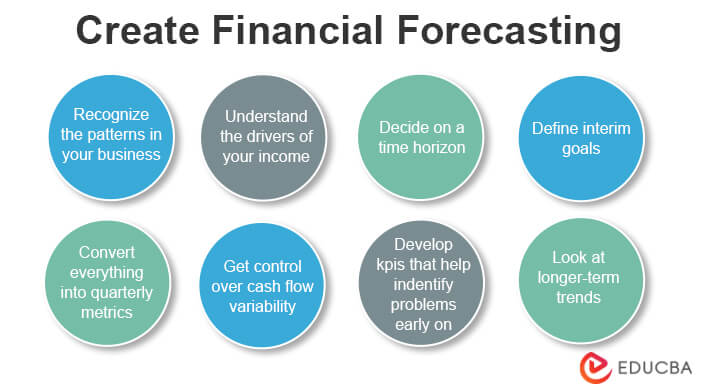
Forecasting Techniques and Models

Accurate financial forecasting is crucial for business growth. Understanding and applying appropriate forecasting models allows businesses to make informed decisions regarding resource allocation, investment strategies, and overall operational planning. Choosing the right model depends on factors like data availability, forecasting horizon, and the desired level of accuracy.
Several forecasting techniques exist, each with its strengths and weaknesses. The selection process should be guided by a thorough understanding of the business context and the specific goals of the forecast. This section will explore three common methods: time series analysis, regression analysis, and scenario planning, highlighting their applications and limitations.
Time Series Analysis
Time series analysis utilizes historical data to predict future values. This approach is particularly useful when data exhibits patterns over time, such as seasonality or trends. The method involves identifying these patterns and extrapolating them into the future. Simple methods include moving averages and exponential smoothing, while more complex techniques involve ARIMA models and other sophisticated statistical approaches.
For example, a retail business might use time series analysis to forecast sales based on past sales data, accounting for seasonal fluctuations (e.g., higher sales during the holiday season). The accuracy of the forecast depends on the stability of the historical patterns and the absence of significant external shocks.
Regression Analysis
Regression analysis explores the relationship between a dependent variable (e.g., sales) and one or more independent variables (e.g., advertising spend, price, economic indicators). This technique allows businesses to understand how changes in independent variables might affect the dependent variable. For instance, a company could use regression analysis to model the relationship between its marketing expenditure and subsequent sales revenue.
A linear regression model, for example, would aim to find the best-fitting straight line through the data points, allowing for predictions of future sales based on planned marketing investment. The accuracy of this method relies heavily on the quality and relevance of the independent variables included in the model and the underlying assumption of a linear relationship.
Scenario Planning
Unlike the quantitative approaches of time series and regression analysis, scenario planning is a qualitative method that considers different potential futures. This approach is particularly useful in uncertain environments where historical data may not be a reliable predictor of future outcomes. Scenario planning involves developing several plausible scenarios based on different assumptions about key factors affecting the business.
For example, a company might develop three scenarios: a best-case scenario (high growth), a base-case scenario (moderate growth), and a worst-case scenario (low growth or recession). Each scenario would have different financial projections, allowing the business to prepare for a range of possibilities. This method is valuable for strategic decision-making, enabling businesses to develop contingency plans and adapt to unexpected events.
Step-by-Step Guide: Time Series Analysis using a Simple Moving Average
This guide demonstrates a basic time series forecasting method using a three-period moving average. This approach is suitable for situations with relatively stable data and a short forecasting horizon.
- Gather historical data: Collect data for the dependent variable (e.g., monthly sales) over a sufficient period. Let’s assume we have monthly sales data for the past 12 months.
- Calculate the moving average: For a three-period moving average, sum the sales for the current month and the two preceding months, then divide by three. Repeat this calculation for each month, starting from the third month.
- Forecast future values: The last calculated moving average serves as the forecast for the next month. This process can be repeated for subsequent months, though accuracy diminishes with the forecasting horizon.
Example:
| Month | Sales | 3-Month Moving Average |
|---|---|---|
| Jan | 100 | |
| Feb | 110 | |
| Mar | 120 | 110 |
| Apr | 130 | 120 |
| May | 125 | 125 |
| Jun | 140 | 131.67 |
| Jul | 150 | 138.33 |
| Aug | 145 | 145 |
| Sep | 160 | 151.67 |
| Oct | 170 | 158.33 |
| Nov | 165 | 161.67 |
| Dec | 180 | 171.67 |
The forecast for January of the next year would be 171.67, based on the three-month moving average of November, October, and December.
Using Forecasts to Guide Business Decisions
Financial forecasts are not merely static predictions; they are dynamic tools that inform and shape strategic decision-making within a business. By providing a forward-looking view of potential financial outcomes, forecasts enable businesses to proactively address challenges and capitalize on opportunities, ultimately driving growth and enhancing profitability. They provide a framework for informed choices across various departments and functions.Forecasts illuminate potential risks and rewards, allowing businesses to make data-driven choices rather than relying on intuition or guesswork.
This proactive approach significantly reduces the uncertainty associated with business planning and resource allocation, fostering a more stable and successful trajectory.
Resource Allocation Optimization through Forecasting
Effective financial forecasting directly impacts resource allocation. By projecting future cash flows, revenue streams, and expenses, businesses can optimize their use of capital, personnel, and other resources. For instance, a forecast indicating a surge in demand for a particular product allows a company to proactively increase production capacity, secure additional raw materials, and hire extra staff, preventing potential stockouts and maximizing sales opportunities.
Conversely, a forecast predicting a downturn can lead to cost-cutting measures, such as reduced marketing spend or temporary workforce adjustments, minimizing potential losses.
Case Study: Growth Through Forecasting at “InnovateTech”
InnovateTech, a software company, utilized financial forecasting to achieve significant growth. Their process involved several key steps:
- Market Research and Trend Analysis: InnovateTech conducted thorough market research to identify emerging trends and potential growth areas within the software industry. This involved analyzing competitor activities, customer feedback, and technological advancements.
- Development of Financial Models: Based on their market research, they developed detailed financial models that projected revenue, expenses, and profitability over a three-year period. These models incorporated various scenarios, including optimistic, pessimistic, and most likely outcomes.
- Strategic Investment Decisions: Using the forecast data, InnovateTech prioritized investments in research and development of new software products identified as having high growth potential. They also strategically allocated resources to enhance their marketing and sales efforts in targeted market segments.
- Resource Allocation: The forecasts guided their hiring decisions, allowing them to recruit skilled developers and marketing professionals strategically, aligning their workforce with projected demand.
- Performance Monitoring and Adjustment: Throughout the three-year period, InnovateTech regularly monitored their actual performance against the forecast. Any significant deviations prompted adjustments to their strategies and resource allocation, ensuring they remained on track to achieve their growth objectives.
Outcomes: InnovateTech experienced a 40% increase in revenue and a 25% improvement in profitability over the three-year period. This success was directly attributed to their proactive use of financial forecasting to guide strategic decisions and optimize resource allocation. The ability to anticipate market shifts and allocate resources effectively minimized risks and maximized opportunities for growth.
Visualizing Financial Forecasts
Effective visualization is crucial for understanding and communicating complex financial forecasts. A well-designed visual representation can transform raw data into actionable insights, making it easier for stakeholders at all levels to grasp the implications of projected financial performance. This section explores various visualization techniques and their application in presenting financial forecasts.
A key advantage of visual representations is their ability to quickly convey trends and patterns that might be missed when reviewing numerical data alone. Charts and graphs can highlight key performance indicators (KPIs) and their projected trajectories, enabling a more intuitive understanding of the forecast’s implications for the business.
Hypothetical Financial Forecast Visualization
The following table presents a hypothetical financial forecast for a small business over the next four quarters. This example uses a simple table format; more sophisticated visualizations, such as line graphs or bar charts, could also be used depending on the specific needs and audience.
| Quarter | Revenue | Expenses | Profit |
|---|---|---|---|
| Q1 2024 | $50,000 | $30,000 | $20,000 |
| Q2 2024 | $60,000 | $35,000 | $25,000 |
| Q3 2024 | $75,000 | $40,000 | $35,000 |
| Q4 2024 | $80,000 | $45,000 | $35,000 |
Benefits of Different Visualization Techniques
Different visualization techniques are suited to different aspects of financial forecasting. For example, a line graph effectively illustrates trends over time, while a bar chart is better for comparing different categories. Pie charts can show the proportion of different components within a total, such as the breakdown of expenses. Choosing the appropriate technique depends on the specific message being communicated and the audience’s familiarity with different chart types.
Communicating Forecast Results to Different Stakeholders
The way a financial forecast is presented should be tailored to the audience. For example, a presentation to the board of directors might include detailed charts and graphs, along with a comprehensive narrative explaining the underlying assumptions and potential risks. In contrast, a communication to employees might focus on key highlights and their implications for job security or future opportunities.
Simplicity and clarity are key for all stakeholders.
For instance, a concise email to employees could highlight the projected revenue growth and its impact on potential bonuses or salary increases. A more detailed report for investors could include a sensitivity analysis showing the impact of different economic scenarios on the forecast, accompanied by charts demonstrating projected return on investment (ROI).