Interpreting and Communicating Financial Model Results
A well-constructed financial model is only as useful as its interpretation and communication. Understanding the model’s outputs and effectively conveying those insights to stakeholders is crucial for informed decision-making. This section explores how to interpret model results, present them clearly, and communicate complex financial information effectively.
Effective Interpretation of Financial Model Outputs
Interpreting the outputs of a financial model involves a thorough understanding of the underlying assumptions, inputs, and calculations. It’s not simply about looking at the numbers; it’s about understanding what those numbers mean in the context of the business. This requires a critical evaluation of both the quantitative results and the qualitative implications. For example, a projected increase in revenue might be positive, but if it’s accompanied by a significant increase in operating expenses, the overall profitability might be less impressive than initially perceived.
Sensitivity analysis, scenario planning, and stress testing are crucial tools to understand the model’s robustness and the potential impact of various uncertainties. By systematically investigating these areas, you can form a comprehensive and nuanced understanding of the model’s projections.
Presenting Financial Model Results to Stakeholders
Presenting financial model results requires tailoring the communication to the audience. For executive management, a concise summary highlighting key findings and implications is sufficient. For more technical audiences, a deeper dive into the model’s assumptions, methodology, and detailed results might be necessary. Regardless of the audience, clarity and conciseness are paramount. Using clear and simple language, avoiding technical jargon where possible, and focusing on the key takeaways will ensure the message is understood.
The presentation should follow a logical flow, starting with an overview of the model’s purpose and key assumptions, followed by a presentation of the key results, and concluding with recommendations based on the findings.
Strategies for Communicating Complex Financial Information
Effectively communicating complex financial information often involves simplifying the data without sacrificing accuracy. This can be achieved through the use of visual aids, storytelling, and analogies. Instead of presenting long tables of data, summarize key findings using charts and graphs. Frame the results within a narrative, explaining the context and implications of the findings. Using real-world examples or analogies can help stakeholders grasp complex concepts more easily.
For instance, comparing projected growth rates to familiar benchmarks, like the growth rate of a well-known company in the same industry, can provide context and make the information more relatable.
Visual Representations Enhancing Understanding
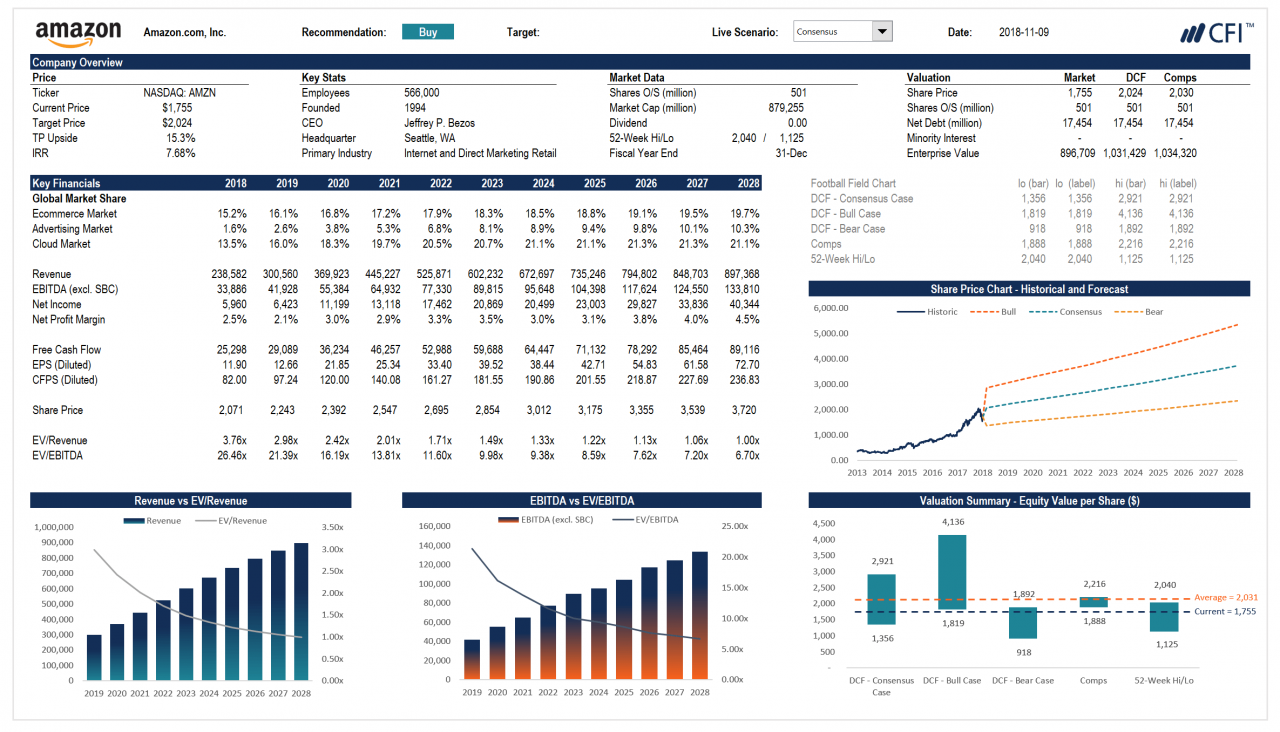
Visual representations are crucial for simplifying and communicating complex financial information. A well-designed chart or graph can instantly convey key trends and insights that would be difficult to grasp from raw data alone.For example, a line graph could effectively illustrate revenue growth over time, clearly showing periods of growth and decline. The x-axis would represent time (e.g., years or quarters), and the y-axis would represent revenue.
Different lines could represent different scenarios (e.g., best-case, base-case, worst-case) or different revenue streams.Another effective visual is a bar chart, which is useful for comparing different categories. For instance, a bar chart could compare the profitability of different product lines or business segments. The x-axis would represent the categories (e.g., product lines), and the y-axis would represent profitability (e.g., net income or profit margin).
The length of each bar would visually represent the magnitude of the value.A waterfall chart can illustrate the different components that contribute to a final result, such as net income. This chart would visually show how starting revenue is impacted by various factors (e.g., cost of goods sold, operating expenses, taxes) until reaching the final net income figure.
Each bar represents a different component, and the chart visually demonstrates the cumulative effect of these components.